|
|
|
Software Metering |
|
User Manual |
|
|
|
|
|
Build 2.2.0.50
|

|
This is the official user manual on using SAMLite for Software Metering |
Table of Contents
Software Metering Group Creation
Software Metering Group Match Items
Removing Software Metering Group Match Items
Listing Software Metering Groups
|
Software Metering |
Software Metering Overview
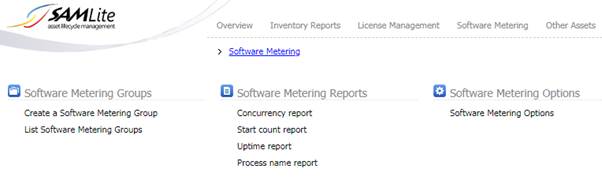
SAMLite Software Metering features allow you to generate reports on the usage of software in your organization.
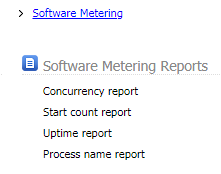
1. Concurrency report – shows the number of machines running software at time periods in the selected time range.
2. Start count report – shows the number of times software has been launched at time periods in the selected time range
3. Uptime report – shows the total net uptime of software at time periods in the selected time range.
4. Process name report – lists processes by their Software Metering Group Name, Publisher, Process Name, File Description, Company and their total net uptime and machine counts for the selected time range.
To speed up report generation you can reduce the amount of
data by going to Administration > System Settings > System options
and enabling Status History Maintenance and setting Maximum Status
History Days to the desired value e.g. 90 for a maximum of 90 days of data.
Then older Status History data will be deleted periodically.
Software Metering Setup
In order to gather data required for Software Metering ensure there is a line GetRunningProcessesEnabled=1 in the SAMScanConfig.txt file used by the localscan.vbs scanning script.
Add GetProcFileDetails=1 in the SAMScanConfig.txt file to gather extra executable file information of the running processes e.g. Company, Product Version.
Add GetEventLog=1 in the SAMScanConfig.txt file to gather event log information in order to account for machine downtime (hibernate/sleep) when calculating process uptimes.
|
Setting Name |
Description |
|
GetRunningProcessesEnabled |
Set to 1 to gather information about running processes. This can slow down scanning and increase bandwidth usage significantly. |
|
GetProcFileDetails |
Set to 1 to gather executable file information of running processes |
|
GetEventLog |
Set to 1 to gather Windows Event Log information. This can slow down scanning and increase bandwidth usage significantly. See the Event Log Advanced Settings section in SAMLite Installation and Initial Setup for more information. |
|
WebConfigURL |
http://[SAMLiteServerAddress]/SAMLiteWebService/handler.ashx |
Software Metering Groups
Software Metering Groups are used to group running processes of interest for reporting purposes.
Software Metering Group Creation
Create Software Metering Groups to group running processes of interest for reporting purposes.
Log in to the SAMLite Web Dashboard and go to the Software Metering page. From there click on Create a Software Metering Group in the Software Metering Groups section.
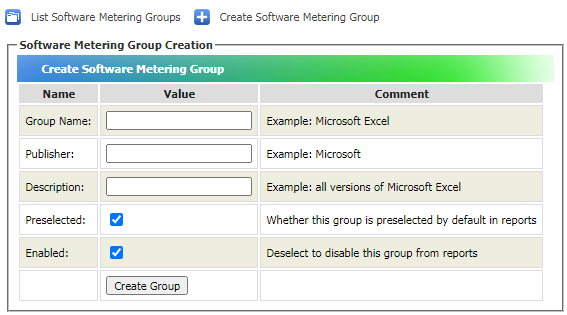
The Preselected option controls whether a group is selected by default in reports.
If the Enabled option is not selected the group will not show up in reports.
Fill in the details and click on Create Group.
You should then see something similar to the following:
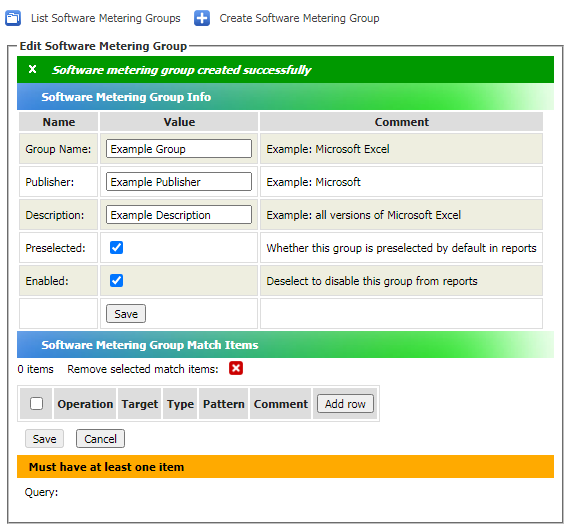
Software Metering Group Match Items
Next add Software Metering Group Match Items to generate a query that will match all processes that are to belong to this Software Metering Group.
Click on the Add Row button to add the first item.
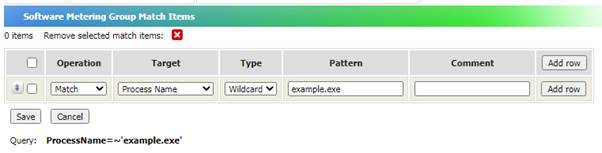
The above example matches processes that have the Process Name example.exe.
The following example matches processes that have the Process Name example.exe or example2.exe and have a File Version that matches 1.* or 2.*.
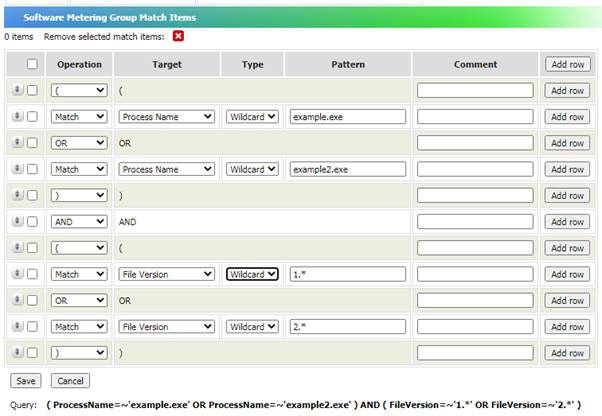
The “Query:” section below the save button displays a summary of the query.
When Type is set to Exact the pattern is used as an exact match.
When Type is set to Wildcard, a * in the pattern matches zero or more characters, ? matches one character).
The Comment fields are for comments. Comments are just for reference purposes and not used for matching.
When done, click on Save to save the changes.
Removing Software Metering Group Match Items
To remove unwanted match items, use the leftmost checkboxes
to select the items you want to remove and then click on ![]() to remove
them. Click on the top left most checkbox to select/deselect all items.
to remove
them. Click on the top left most checkbox to select/deselect all items.
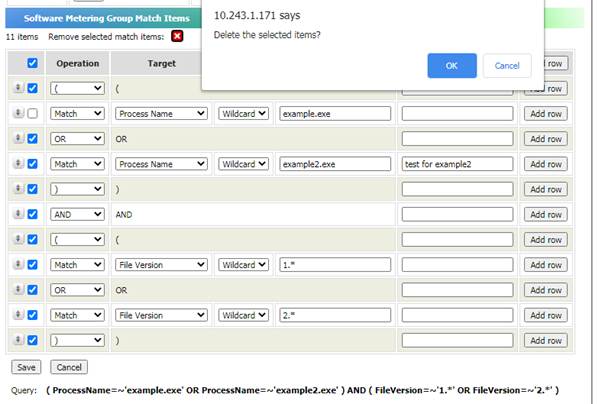
Click on OK to confirm deletion.
Then click on Save to save the changes.
Listing Software Metering Groups
To list Software Metering Groups log in to the SAMLite Web Dashboard and go to the Software Metering page. From there click on List Software Metering Groups in the Software Metering Groups section.
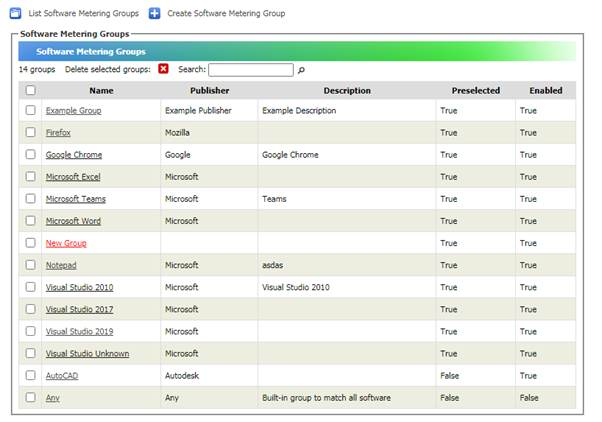
In the above screen shot New Group is in red because it does not have any Software Metering Group Match Items.
The Any Software Metering Group is a built in group that matches all software. By default it is not Preselected nor Enabled for most reports. The Any group is automatically included and used in the Process Name report where it will match all processes.
Software Metering Reports
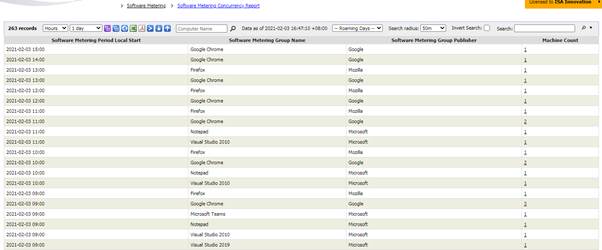
Concurrency Report
This report shows the number of machines running software at time periods in the selected time range. For each period a machine has to be running the software for the entire period for it to be counted. If the software is just run on a machine for part of the period it is not counted.
For this concurrency report if there are multiple instances of the same software running at the same time they are just counted once. For example if a machine has 8 Notepad processes running for an entire period, they are counted as just 1.
You can select the period unit with the drop down selector on
the top left ( ![]() ).
The period unit can be hours, days or months. The other drop down next to it
controls the period range for the report. This can be from 1 day ago to up to
12 months.
).
The period unit can be hours, days or months. The other drop down next to it
controls the period range for the report. This can be from 1 day ago to up to
12 months.
Click ![]() to add
or remove columns to this report. Remove all columns to reset the report to the
default report columns.
to add
or remove columns to this report. Remove all columns to reset the report to the
default report columns.
If you enter a computer name in the computer name field the
report will be just for that computer alone. The ![]() text indicates the date
and time the reference tables used for the reports were built. To speed up
report generation, reference tables are built on a periodic basis. The schedule
for building these tables can be controlled in the Software Metering Options
page.
text indicates the date
and time the reference tables used for the reports were built. To speed up
report generation, reference tables are built on a periodic basis. The schedule
for building these tables can be controlled in the Software Metering Options
page.
Start count report
This report shows the number of times software has been launched at time periods in the selected time range. For this report if there are multiple instances of the same software launched within the same period they are all counted. Note that child processes of a software instance are not counted – for example when you launch Google Chrome it creates multiple chrome.exe processes, and may create new chrome.exe processes later. The creation of these child processes are not counted in the start counts of this report. Only the launch of a parent process is counted.
The rest of the controls and usage are similar to those for the Concurrency Report.
Uptime report
This report shows the total net uptime for software. For this report if there are multiple instances of the same software launched within the same period they are combined and counted as one. For example if the period is one hour and there was one Notepad instance running for the first 45 minutes and another Notepad instance running for the last 30 minutes of that period. They will count as Notepad running for 1 hour.
If event log information is gathered the machine downtime will be estimated from event log data and subtracted from the uptime if the machine downtime period overlaps the uptime period. For example if Notepad was launched at 9 pm yesterday but the machine was set to sleep or hibernate at 10pm and only woke up at 9 am with Notepad still running. Then 11 hours of downtime will be subtracted from the uptime for notepad.
The rest of the controls and usage are similar to those for the Concurrency Report.
Process name report
This report lists processes by their Software Metering Group Name, Publisher, Process Name, File Description, Company and their total net uptime and machine counts for the selected time range.
This report lists all processes by default not just processes that match user created Software Metering Groups. This is done by listing processes that match the built-in “Any” Software Metering Group, which is selectable in this report. This can be convenient for creating a list of running executables in an organization.
The rest of the controls and usage are similar to those for the Concurrency Report.
Software Metering Options
Software Metering Options
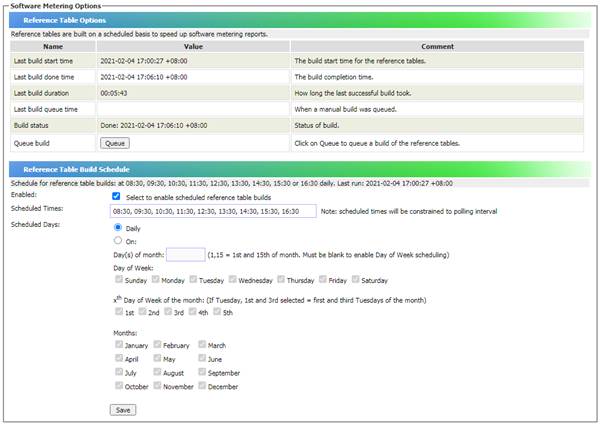
This page allows you to manually queue a rebuild of the reference tables used for generating the Software Metering reports. Also listed is information about the build status and previous builds.
You can also configure and enable a schedule for automatically building the reference tables.
The scheduled times can be a single time (in 24 hour format) or multiple times separated by a comma.
Note that building the reference tables can be CPU and resource intensive and take quite a long time if there are very many machines and lots of data. You can reduce the amount of data by going to Administration > System Settings > System options and enabling Status History Maintenance and setting Maximum Status History Days to the desired value e.g. 90 for a maximum of 90 days of data. Then older Status History data will be deleted periodically.